Vector data processing
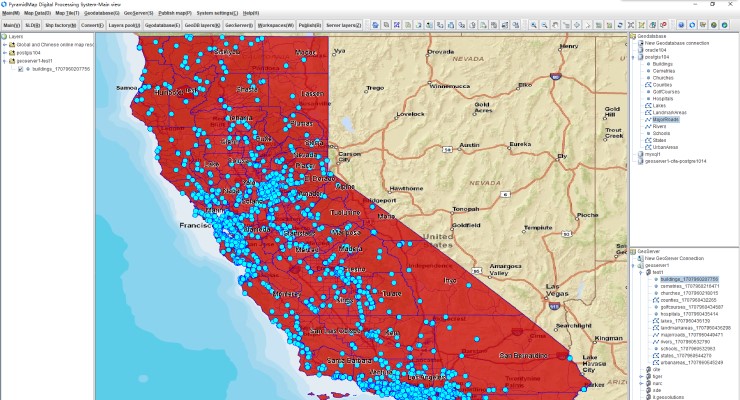
Vector maps combine attribute data with spatial vectors, thereby presenting infinite possibilities for map data rendering.
We provide compatibility and adaptation for different data sources, including Shp, GeoJSON, structured data with WKT specifications such as CSV and Excel, enterprise level
geodatabases such as Oracle, PostGIS, MySQL, and professional map servers such as ArcGIS Server and GeoServer. And constantly update, adding new layers, fields and values
to reflect real-time changes in data supply. Specifically, combined with style symbols, independent value rendering for specific attribute data can make map features more
detailed and restore the true color of the data.
The typical cases based on vector map applications include: environmental governance of land and resources, disaster prevention and resource planning,
auxiliary design of urban construction, operation supervision of gas, heating, and water supply and drainage pipelines, line inspection of power and communication, project control of infrastructure projects,
path analysis of transportation and logistics, and so on. It can be said that almost in any field of the national economy, there are shining highlights of GIS technology.
Raster data processing
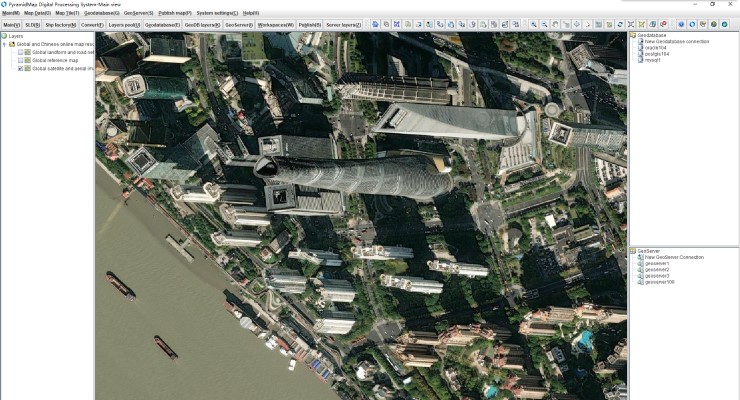
Support raster tile blocks of different data source types, including high-resolution satellite and aerial images of global base maps.
Raster composite imaging is a pixel based data format that effectively represents continuous surfaces. Raster images carry coordinate systems or projection definitions and latitude and longitude information,
enabling geographic location registration and comparison. Raster images can achieve a balance between freshness and aesthetic quality through color correction and data optimization sampling processing.
Satellite imagery is widely used in core areas such as natural resource management, environmental monitoring and protection, agriculture and food safety,
urban planning and development, national security, and national defense. Discovering surface changes through satellite imagery, monitoring the development and utilization of natural resources such as land,
minerals, forests, and grasslands, monitoring climate change, forest conditions, marine health, and natural disasters, providing valuable information for natural resource management, environmental protection,
urban planning, land use, and national security.
Large scale map data storage and hosting services
Establishing large-scale map data storage and concurrent request mechanisms is the foundation for achieving map visualization.
To achieve this goal, we provide mutual conversion between diverse heterogeneous datasets, support bidirectional conversion between Shp, CSV, Excel, and GeoJSON formats,
as well as import and export of GeoDatabase and GeoServer layers and implement a map data interoperability mechanism.
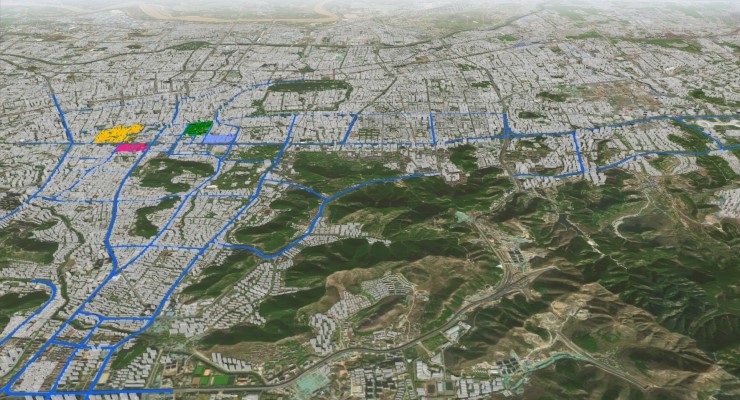
As shown in the above figure, we overlay urban gas pipelines on a simulated terrain map in a real three-dimensional environment to
form a visual pipeline network system in a panoramic view. The blue pipeline data is stored in the Oracle geodatabase and published as a layer service in GeoServer and finally implemented
for web and mobile map visualization applications through the WMS/WFS standardized interface.
Building flexible and vibrant map visualization applications
The purpose of map visualization is to provide a more panoramic preview, global control, and auxiliary design effect in a digital environment,
based on accurate spatial coordinate data and similar map content. Through efficient and detailed display rendering, the requested data is realistically restored to the real scene in the actual geographic environment.
We support various forms of map content, including vector and raster files, GeoDatabase layers, map online resource, map tiles offline and more others data,
and provide the engineering methods to implement these data patterns. Especially for the complex map data processing, database storage and map service all of these can be process more easyly in the
JuncTryand the PyramidMap digital processing platform.
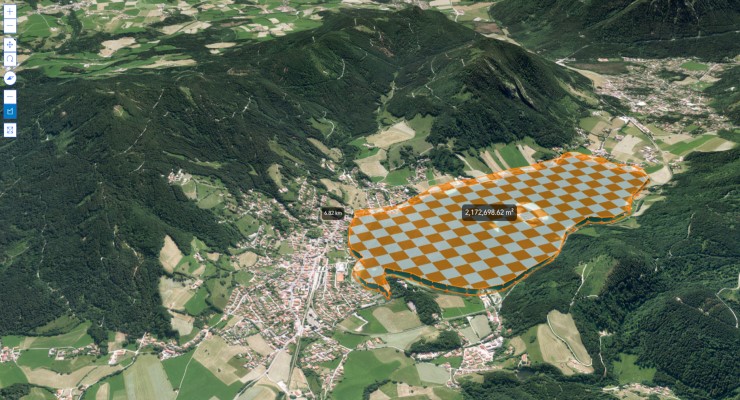
As shown in the above figure, we simulate and present the panoramic landscape of a national forest park within a nature reserve in a 3D environment and provide auxiliary design and preview effects for measurement and planning.


